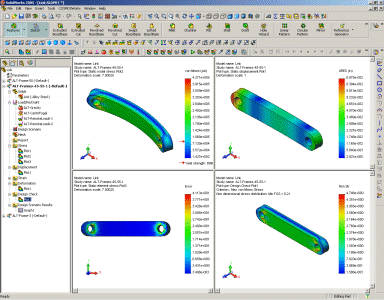
Displaying Results in the Window Panes
You can display multiple results simultaneously in split windows. You can also plot and compare results between different design studies. The Compare Results tool provides another way to compare plots in one or more studies.

To display multiple results in split windows:
-
After running your study, split the graphics area into 4 panes.
-
Click inside any pane, then define a plot for the desired study.
The plot is displayed in the active pane.
-
Click inside another pane to activate it then define another plot in the same study.
-
The plot is displayed in the active pane.
-
To edit the definition of a plot, click inside the pane in which the plot is displayed then edit the definition of the plot.
To display results from different studies simultaneously:
-
After running the desired studies successfully, split the graphics area.
-
Click inside any pane to activate it.
-
Define a result plot from a study.
The plot is displayed in the active pane.
-
Activate another pane then define a plot of the same result from another study.
The plot is displayed in the active pane.
 You can define up to 4 plots from 4 different studies.