A Design Insight plot shows the regions of the model that carry the loads most efficiently. Some users may recognize this plot as a "load path" plot. You can use this information to reduce the model's material.
To display this PropertyManager, run a static study. Right-click Results  and select Define Design Insight Plot.
Load Level
Adjust the Load Level slider between Most Loaded and All.
If an option has sub-options, use a definition list in the option description to list the sub-options.
| Most Loaded |
When the slider is set to Most Loaded, the portions of the model that carry the most load are plotted in blue. Typically, this is only a small portion of the model. The translucent areas of the plot indicate the boundary of the original model.
|
| All |
The entire model is plotted in blue.
|
Design Insight plots do not suggest where to add material. You may infer this information from these plots, but this is not the intention. These plots are most effective when you analyze the largest practical model and remove material to optimize the volume.
Advanced Options
| |
Display symmetric results |
Available for models with symmetry restraints or circular symmetry.
Select to view the design insight plot for the whole model. The results are mirrored about the planes of symmetry for models where you analyze
half, a quarter, or one-eighth of the actual geometry.
For circular symmetry, results are
repeated cyclically about the defined axis of revolution. The translucent representation of the original geometry is not shown when you select this option. The original geometry for the Simulation study represents half, one-quarter, one-eighth, or a circular segment of the model.
|
The following example highlights the benefits of a Design Insight plot.
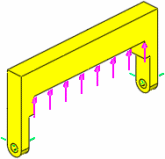
 Original model showing loads (pink) and restraints (green)
|
 Design Insight plot with a continuous path between the loads and restraints
|
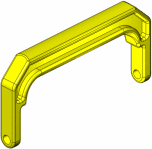
 Model after material was manually removed by a designer from regions that did not carry much of the load
|
|