After a successful run of the Warp analysis module, you can view deformation plots of the part due to stresses that develop during filling and packing, and stresses due to thermal contraction after the part is ejected and fully cooled.
To open the Warp Results PropertyManager:
- In the PlasticsManager tree, expand Results, and click Warp Results, or
- In the SOLIDWORKS Plastics CommandManager, click Warp Results.
Available Results
| |
Total Stress Displacement
|
Shows the total deformation of your part after it is molded, ejected, and cooled to room temperature. All stresses and thermal effects are considered in this result.
|
| |
In-mold Residual Stress Displacement
|
Shows the portion of the warping deformation that is due to stress that develops during filling and packing, until just before the part is ejected. This stress includes the effects of non-uniform cooling and freezing while the part is in the mold.
|
| |
Quenching Thermal Stress Displacement
|
Shows the portion of the warping deformation that develops after the part is ejected, due to the stress associated with thermal contraction as the part is cooled to room temperature.
|
| |
Sink-Mark Profile
|
Shows the depth of sink marks after the part has been ejected and cooled to room temperature. All thermal, stress, and warping effects are included in this result.
|
| |
In-mold First Principal Residual Stress |
Shows the portion of the warping deformation that is due to stress that develops during filling and packing, until just before the part is ejected. This stress includes the effects of non-uniform cooling and freezing while the part is in the mold. |
| |
De-molding First Principal Residual Stress |
Shows the magnitude of the first principal component of stress that remains after the part is ejected, cooled to room temperature, and allowed to deform freely.
|
Advanced
Available for displacement results. These controls affect only the color display of the plot. The deformed shape that is displayed always respects the sign (positive or negative) of the displacement result.
| |
Direct Value
|
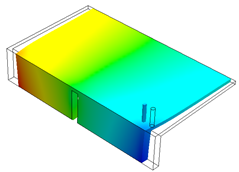
Displays results with color contours that respect the sign of the displacement. For example, displacements of -1.0 and +1.0 are displayed with different colors. |
| |
Absolute Value
|
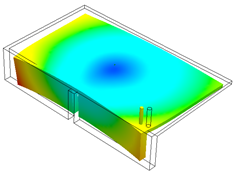
Displays results with color contours that map the magnitude of the displacement, but ignore its sign. For example, displacements of -1.0 and +1.0 are displayed with the same color. Select Absolute Value to easily identify regions with the largest deformation, regardless of sign.
|
| |
Include Shrinkage
|
|
| |
Include Warp
|
|
 |
 |
| Displacement Plot, Z-direction, Direct Value |
Displacement Plot, Z-direction, Absolute Value |
Deformation Scale
Available for displacement results.
| |
Scale
|
Magnifies the deformation results. This is very useful for inspecting warped shapes with tiny deformations. A Deformation Scale of 1.0 shows the actual deformation.
|
Set Reference
Available for displacement results. These controls modify the reference location and orientation used to compute displacement results. Setting a reference can be useful in comparing displacements with those that you measure after placing the part in a checking fixture or jig.
| |
Based on origin
|
Selects a location on the model to be used as the baseline of deformation. You can either click a node on the model or use the mouse wheel to scroll over mesh nodes. A glyph is displayed on the selected origin. Enter 0 in the text box to use the default global origin.
|
| |
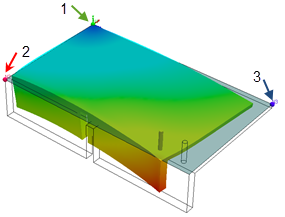
Based on plane
|
Selects three nodes which define a reference plane. The deformed part is reoriented such that these three nodes remain in the reference plane that they define.
|
First Reference
|
Select the first node and click Apply. This is the origin of the reference system.
|
|
Second Reference
|
Select the second node, and click Apply.
|
|
Third Reference
|
Select the third node, and click Apply.
|
|
| |
Apply
|
Applies the selected reference. |
| |
Reset
|
Resets the reference back to the default global origin. |
| |
Fix Reference Origin |
Adjusts the orientation of the model to the displayed orientation. |
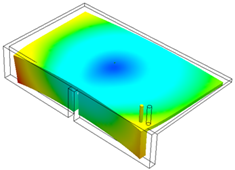 |
| Displacement plot based on default global origin. |
 |
 |
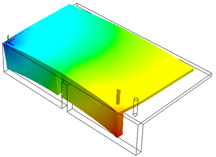
| Displacement plot based on origin selected on the left corner. |
Displacement plot based on reference plane defined by three corner nodes. |
Animation
You can animate the warp results plots. Use the available tools to control the animation speed, pause, stop, or loop the animation.
Report Options
| |
X-Y plot
|
Use Measure (SOLIDWORKS Plastics CommandManager) to pick nodes on the part at locations of interest. The selected nodes are listed under Node List.
The graph in the right window displays the result value for each node. Curve points are numbered in the order in which the nodes were selected. You can select any of the available results to update the graph with the selected nodes.
|
| |
Results Adviser |
Activates the Results Adviser panel. The top window provides a brief interpretation of the simulation results. It also provides recommendations for geometry and process parameters changes to improve the product quality.
The lower window describes the active result quantity.
|
| |
Export to eDrawings |
Exports the warp result plot to an eDrawings file format (*.EPRT). |