Description
A viscoelastic slab is subjected to a temperature loading on its outside faces. The slab is very long in the Z-dir and has a thickness of 2 in.
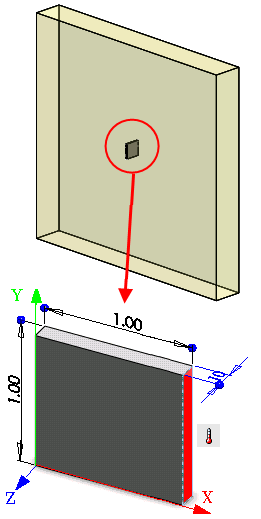
A typical away-from-boundaries region of dimensions 0.1in. x 1in. x 1in. (half slab thickness due to symmetry) is modeled as shown in the figure. Investigate the response of the slab corresponding to different time values.

File Name
Browse to drive
letter:\Users\Public\Public Documents\SOLIDWORKS\SOLIDWORKS
version\samples\Simulation
Examples\Verification\Nonlinear_Thermal.SLDPRT and open the
file.
Study Types
Transient thermal and nonlinear static with thermal effects.
Meshing Parameters
Use a Global Size of 0.1".
Material Model
Viscoelastic
Modeling Hints
The half-thickness of the slab (H/2 = 1 in) is modeled. First a transient thermal analysis is performed, where at the end of 6 sec the slab reaches its thermal equilibrium condition. A nonlinear analysis is performed with temperatures at any time obtained by interpolation from the thermal study.
Material Properties
Modulus of elasticity = 10,000 psi, Poisson's ratio = 0.4833, Coefficient of thermal expansion = 1e-5/ºF, Shear relaxation modulus = 0.901, Shear relaxation time = 0.9899 sec, Glassy transition temperature = 70 ºF, First constant for WLF equation = 4.92, Second constant for WLF equation = 215, Mass density = 386.22 lb/in3, Thermal conductivity = 1/ sec in ºF, Specific heat = 0.0025892 / lb ºF.
Restraints and Loads
Uniform temperature T
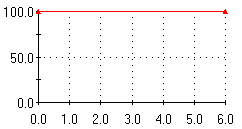
0 = 100 ºF is applied at the outer face as shown in the figure. X-axis is sec, Y-axis is ºF.

All the faces are restrained in the Z- dir, the top and bottom faces are restrained in the Y-dir, and symmetry conditions are applied to the face of symmetry.
References
- Carslaw, H.S. and Yeager, J.C., Conduction of Heat in Solids, Clarendon Press, Oxford, 1959.
- Williams, M.L., Landel, R.F., Ferry, J.D., Journal of American Chemical Society, V77, pp. 3701, 1955.