You plot the displacement versus load factor at the center of the shell.
To plot displacement versus load factor:
-
In the Simulation study tree, right-click the Results
 folder and select Define Time History Plot.
-
In the PropertyManager:
- Under Response, make sure that Predefined locations is selected.
- Make sure that Vertex 1 is highlighted.
-
Under X axis,
set Component
 to URES: Resultant Displacement.
-
Under X axis,
make sure Units
 is set to mm.
- Click
 .
.
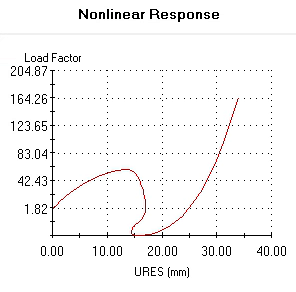
The post buckling behavior of the shell is depicted by the generated graph.
-
Point the mouse pointer to the first point of inflection as shown in the figure below and notice its coordinates at the bottom of the graph window.
The shell starts to buckle at a load factor of 57.5 or a force
magnitude of about 144 N (2.5 x 57.5 = 143.75).