If the plot does not exist, create this plot.
The temperature plot is displayed with the maximum (45.22 °C) and minimum
(44.48 °C) values annotated.
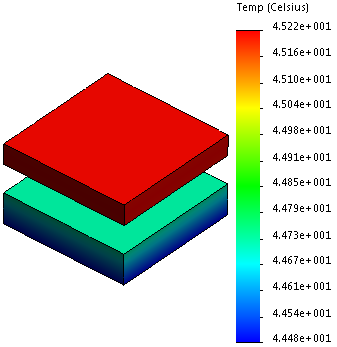
Temperature of the chip is approximately constant at 45.22 °C. The
analytical solution to this problem gives a temperature value of 45.36 °C in
the chip. The error is about 0.3%.