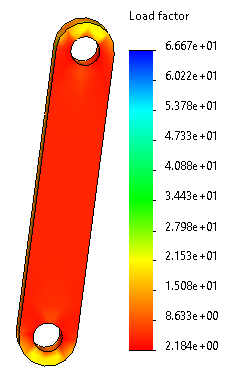
Viewing Damage and Factor of Safety Plots Right-click the Results folder and click Define Fatigue Plot . In the PropertyManager, do the following: Under Plot Type, select Damage. Click . The Damage plot is displayed. The results for the damage factor indicate that the specified event consumes about 4.3 % of the life of the model. Right-click the Results folder and click Define Fatigue Plot . In the PropertyManager, do the following: Under Plot Type, select Load Factor. Click . The Load Factor plot is displayed. The load factor plot indicates that the link part fails due to fatigue if the current loads are multiplied by 2.18 (the minimum load factor). Parent topicFatigue Analysis of a Link Part Previous topic Running Fatigue Analysis and Viewing Results Next topic Viewing the Biaxiality Plot