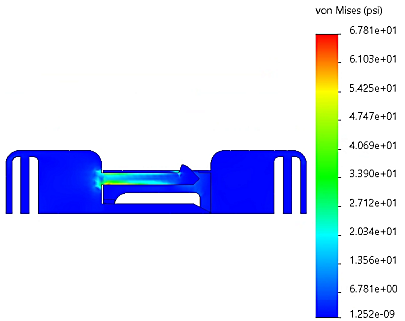
Viewing the Results To view the default von Mises stress plot, in the Simulation study tree, expand the Results folder. Double-click the Stress1 (-vonMises-) plot icon. In the PropertyManager, under Display, select psi as the plot units . Under Plot Step, in the Plot Step box , type 15. Click . Click Front on the Standard Views toolbar. The stresses that appear in the last step are negligible as expected. To plot the maximum von Mises stresses across all solution steps, in the Simulation study tree, right-click the Results folder, and select Define Stress Plot. In the PropertyManager: Under Display, make sure that Component is set to VON: von Mises Stress, and set Units to psi. Under Plot Step, click Plot bounds across all steps and make sure Maximum is selected. Under Deformed shape, make sure True scale is selected. Under Property, click Associate plot with name view orientation, and select *Front from the menu. Under the Chart Options tab, set Number Format to floating and click . Parent topicSnapping of a Clip Assembly Previous topic Defining Mesh Control and Meshing the Model Next topic Viewing Stress History