You can use motion study results to plot quantities calculated in a
motion study. Next, plot the acceleration of the linkage.
-
Click Results and Plots
 (MotionManager toolbar).
-
Under Result, for
category, select Displacement/Velocity/Acceleration.
-
For subcategory, select
Linear Acceleration.
-
For result component,
select Tangential Component.
-
Select the front linkage of the guide as shown and click
 .
.
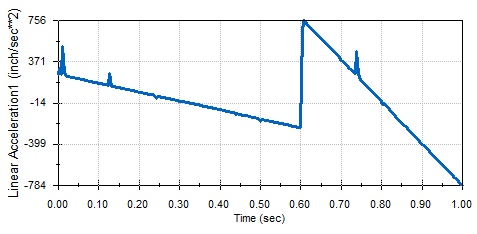
The acceleration plot opens and is zero at the two points at which
the linkage reaches its maximum velocity for each segment of the motor profile.
You can plot the velocity and modify the motor specification to limit the
velocity based on the plot values.
-
Click Close
 to close the plot.