The FOS plot is displayed. The plot is displayed for
Number Format set to
floating and
No of
Decimals set to
2.
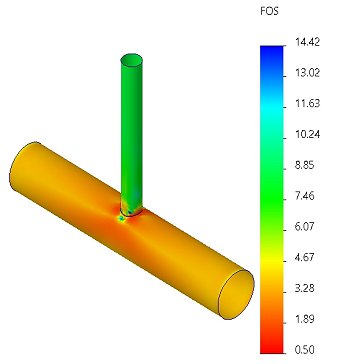
The plot indicates that the model will fail at the
intersecting regions of the T- joint (with FOS less than 1).
Applying the other two failure criteria give very similar
results for the model.