Plotting Principal Stresses
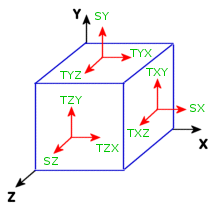
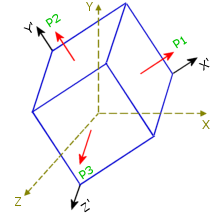
The state of stresses at a point is completely defined by normal and shear stress components in reference to an orthogonal coordinate system XYZ. In general, the values of the stress components change if the coordinate system is rotated. At a certain orientation (X’Y’Z’), all shear stresses vanish and the state of stresses is completely defined by 3 normal stress components. These 3 normal stress components are referred to as principal stresses and the corresponding reference axes (X’Y’Z’) are referred to as principal axes.
|

Figure (1)
|

Figure (2)
|
|
At certain orientation of the material element shown in Figure (1), the shear stress components vanish and stresses reduce to pure normal stresses as shown in Figure (2).
|
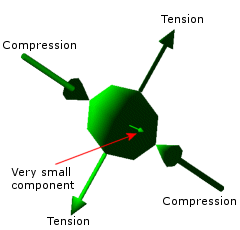
You can plot all 3 components at once. The principal stresses at a node or element center are represented by an ellipsoid. The 3 radii of the ellipsoid represent the magnitudes of the 3 principal stresses. The direction of the stress (tension/compression) is represented by arrows. The color code is based on the von Mises stress values, a scalar quantity. If one of the principal stresses is zero, the ellipsoid becomes a planar ellipse (Figure 2 below). If the 3 principal stresses have the same magnitude, the ellipsoid becomes a sphere (Figure 1 below). In the case of simple uniaxial stress, the ellipsoid becomes a line.
|

Figure (1)
|

Figure (2)
|
|
3 equal principal stresses in tension. The ellipsoid becomes a sphere.
|
One of the principal stresses ia very small.
|
To plot the three principal stresses at nodes or at element centers:
-
In the Simulation study tree, right-click the Results folder and select Define Stress Plot.
-
In the PropertyManager, under Display:
-
Set Component  to VON: von Mises stress.
-
Select the desired Units  .
.
-
Under Advanced Options:
-
Select Show as tensor plot.
-
Select Node values or Element values.
-
Set other options and click  .
.