When you have a part open, the Sustainability Task Pane appears with
the Material section at the top to let you begin by
selecting or modifying the part's material.
This view of the Task Pane is available in
either SustainabilityXpress or full Sustainability.
To display the Task
Pane, do one of the following:
- To use SustainabilityXpress, click SustainabilityXpress
 (Tools toolbar or Evaluate CommandManager tab) or click
.
(Tools toolbar or Evaluate CommandManager tab) or click
.
- To use full Sustainability, click Sustainability (Tools toolbar or Evaluate CommandManager tab) or click
.
Task Pane options are available in both SustainabilityXpress
and Sustainability except where otherwise noted.
Material
The materials that are available include Sustainability data. You can
add a custom material to this list by linking it to a material with similar
characteristics in the default SOLIDWORKS Materials database.
See Adding Sustainability Data to a Custom
Material.
| Class |
Specifies
the major class of material, for example, Steel or Plastics. |
| Name |
Specifies
the
material. |
| Recycled content |
Percentage of material that has been recycled. If the sustainability database contains primary
(virgin), secondary (recycled), and trade mix (default mix of
virgin and recycled content) values, the percentage of recycled
content is shown. If these values are not available, the
recycled content is
0%.
In
SustainabilityXpress, the recycled content value is
read-only.
In Sustainability, you can edit
the recycled content value if you have more precise information.
Use Trade Mix
lets you return to the database defaults.
|
| Weight |
Displays the component's weight
using the selected material. |
| Find
Similar |
Opens the Find Similar Material dialog box,
where you can:
- Compare similar materials to a baseline of
environmental or cost impacts for the selected
material.
- Select a new material to improve the
environmental or cost impact.
See Using the Find
Similar Material Tool.
|
| Set
Material |
Assigns the current selected
material to the active configuration of the model in the
FeatureManager design tree. This material is then applied to all
other aspects of the SOLIDWORKS software, such as mass property
analysis, rendering, and so forth. |
Manufacturing
| Region |
Sets the region of manufacture, for example, Asia. 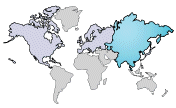 Use the Region
list
or click the map to set the region. Available
regions are North
America, Europe, Asia, Japan, South America, Australia, and
India.
Data is not available for all regions.
Regions that contain data are highlighted when you hover
over them.
|
| Built
to last |
Length of time the part will last. In
SustainabilityXpress, this value defaults to 1 year.
In
Sustainability, the numeric field and increments are
editable.
|
| Process |
Sets a manufacturing process.
Availability depends on the selected material
class. In
SustainabilityXpress, the following values are shown for the
process you
select:
 Total
electricity usage Total
electricity usage Total
natural gas usage Total
natural gas usage Scrap rate
(amount of the material discarded as scrap) Scrap rate
(amount of the material discarded as scrap)
In
Sustainability, editable fields let you change usage amounts if
you have more precise values for your manufacturing process. To
return to defaults, reselect the process.
|
| Paint
Options |
Lets you choose whether to
calculate the environmental impact for a part that has:
- No
Paint
- Water-based
Paint
- Solvent-based
Paint
The surface area of the part is used to
determine the amount of paint and the environmental impact of
painting the part.
|
Use
| Region |
Sets the region where the product
is transported to and used, for example, Asia. Select a region from the
list
or click a region in the map to set the region.
|
Transportation
Shows the default mode of transportation and distance traveled from
the Manufacturing region to the Use region.
In Sustainability, you can edit these values by clicking a transport mode's
button and typing in its
field. When
you add a transportation mode or modify the default mode, the field turns yellow and
a Reset to Defaults button appears to let
you discard your changes.
End of Life
Shows default percentages
for end of life disposal of the part. Default values are based on the part's material in
the sustainability database.
 Recycled Recycled |
 Incinerated Incinerated |
 Landfill Landfill |
In
Sustainability, editable fields let you change the percentages.
The total of the values always equals 100%. If you change the
recycled or incinerated value, the landfill value updates. If you change the
landfill value, the recycled value changes.
When you edit a
value, the field turns yellow and a Reset to Defaults button appears to let you discard your
changes.
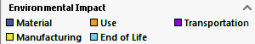
Environmental
Impact
The
Environmental
Impact dashboard provides
realtime
feedback about the environmental impact of the design. SOLIDWORKS Sustainability
products let you select either the CML or TRACI environmental impact assessment
methodology to calculate the environmental indicators (carbon footprint, energy
consumption, water eutrophication, and air acidification).
| |
Impact
Parameters |
 Display the impact for
each parameter on the environment impact areas. Use is
only calculated for assemblies.
|
| |
Duration of
Use |
Length of time
the product will be used. This
number is used with the Built to Last value in the
Manufacturing section to calculate more
accurate
results.
In
SustainabilityXpress, this value defaults to 1 year.
In Sustainability, the
numeric field and increments are editable.
|
| |
Environmental
Impact Areas |
|
Carbon
Footprint
|
A measure of carbon
dioxide and equivalents, such as carbon monoxide and
methane, that are released into the atmosphere primarily
by burning fossil fuels.
|
|
Energy
Consumption
|
All forms of
nonrenewable energy consumed over the entire
lifecycle
of the product.
|
|
Air
Acidification
|
Acidic emissions,
such as sulfur dioxide and nitrous oxides, which
eventually lead to acid rain.
|
|
Water
Eutrophication
|
Contamination of
water ecosystems by waste water and fertilizers,
resulting in algae blooms and the eventual death of
plant and animal life.
|
Pie charts show the percentage of impact of each
parameter on the four environmental impact areas.  Bars below each pie chart
compare the effect of the current impact parameter to the effect
of previous or baseline parameters.
Green bars indicate the
current parameters have a lower environmental impact than the
previous parameters. 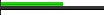 Red bars indicate the
current parameters have a higher environmental impact than the
previous parameters.  Mouse over the bars to see
the current and baseline values. 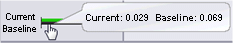 Arrows
next
to
the pie charts emphasize the increase or decrease or decrease  in environmental impact and the percentage of change. in environmental impact and the percentage of change.
|
| |
Material Financial
Impact |

Bars compare the financial impact of the
Current and Previous materials you have
selected.
A green bar indicates that
the current material has a lower financial impact. A red bar
indicates a higher financial impact.
Mouse over the bars to see
the current and previous values.
An arrow
next
to
the bars indicates the percentage of change.
|
 |
Home
|
Returns you to
the initial display of the Environmental Impact
Dashboard. |
| |
Calculation
method |
Calculation
method used for environmental impact results.
|
CML
|
CML (default) is
based on European regional conditions. For
lifecycle
Assessment (LCA) studies outside of North America,
the CML methodology is the most
commonly
used
set of environmental indicators used for
LCA.
|
|
TRACI
|
TRACI is based on
regional conditions of the United States and can be used
to accurately model North American LCA studies.
|
|
 |
Save As |
Opens the
Sustainability
Output dialog box, where you can choose to generate
a:
- Report
Generates a
Sustainability report in .docx format.
- Spreadsheet
Generates a
spreadsheet of results and inputs in .csv
format.
- GaBi input file
Generates a file in .txt format that can be
read into GaBi LCA
software
using the GaBi bill of materials (BOM) import
feature.
|
 |
Set
Baseline |
Specifies
the current selections in the Task Pane as the baseline against
which you compare different selections. The Baseline bar is
the bottom bar below the pie charts. |
 |
Import
Baseline |
Lets you
import an existing baseline to use in the current model. |
 |
Online
Info |
Opens a
website
that provides additional information about Sustainability, including
a calculator to help you understand the impact of your
design. |