By generating a design history graph for the von Mises stress, you identify the time instants and the associated design scenarios where the maximum von Mises stress is likely to occur.
-
In the design study tree, right-click Results and Graphs
 and select Define Design History Graph.
-
Under Y-Axis, click Constraint and select VON: von Mises Stress.
-
Click
 .
.
This graph is displayed:
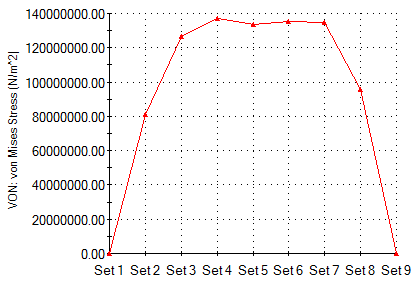
You see that the maximum von Mises stress is likely to occur in the Link part at the time frames that correspond to design sets 4, 5, and 6.
The time instants for these frames are 2.44 sec (frame 62), 2.48 sec (frame 63), and 2.52 sec (frame 64), respectively.
-
Close the graph window and save the part document.
Simulation saves the results for all active scenarios.