Temperature distribution is the default plot for thermal analysis.
To view the temperature distribution plot:
-
In the Simulation study tree, open the Results
 folder.
-
Double-click Thermal1
(-Temperature-) to display the plot.
If the plot does not exist, create this plot.
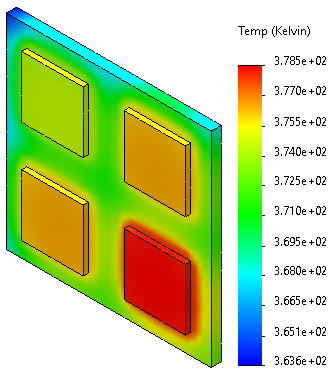
As expected, the corner chip is the coolest and the inner
chip is the hottest because of convection.