After running the analysis, you can view stresses and other results on the model.
-
The Stress1 (-vonMises-)
plot appears automatically in the graphics area.
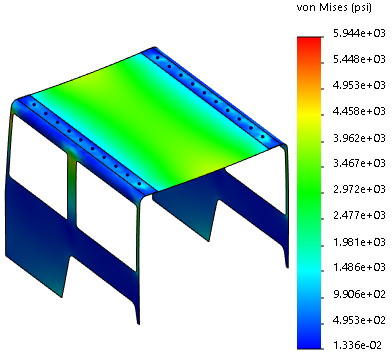
The plot is displayed in units of psi.
-
Save your work and close the assembly document.
Congratulations! You have completed this lesson.