Vector Plot Options PropertyManager

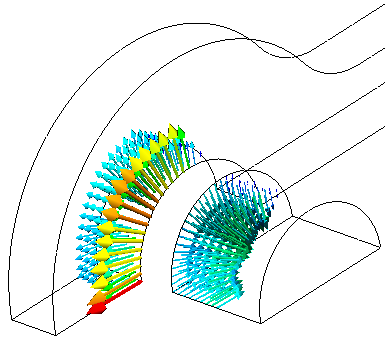
The Vector Plot Options PropertyManager allows you to control the appearance of the vector symbols in a vector plot dynamically.

Options

Size Controls the size of the vectors in the plot. Use the arrows or drag the slider to change the size of the vectors.
Density Controls the density of vectors in the plot.
  Surface only If checked, displays the vectors on the model surfaces only.
  Match color chart Uses the same color map of the plot for the vectors.
  Single color Assigns a user-selected color to all vectors in the plot. To change the vectors color, click Edit color.
The following is an illustration of the vector plot options:
Resultant displacement fringe plot Resultant displacement vector plot (default vector options)
Resultant displacement Vector plot with bigger vector size Resultant displacement Vector plot with larger vector density

Customizing Vector Plots

To customize vector plots:

  1. After running your study, create a vector plot of the desired quantity.
  2. Right-click the vector plot icon and select Vector Plot Options.
    The Vector Plot Options PropertyManager appears.
  3. Use the Size spin arrows to adjust the size of the vector arrows.
  4. Use the Density spin arrows to adjust the density of the vectors in the plot.
  5. If desired, check Surface only to plot the vectors on the model boundaries only.
  6. Select Match chart color to use the same color map used in the plot or Single color to use a single color for the vector plot.
  7. Click .