You need the results of the first five resonant frequencies and their
mode shapes for the different designs. An initial frequency study and five sensors are
defined to track the
results.
For each scenario, the Design Study runs the Ready study. The Ready study then
updates the sensor values which are the results for each scenario.
-
In the FeatureManager design tree, review the Sensors
 folder.
You must define frequency sensors to track the results of
a frequency simulation study.
-
Select the Ready
frequency study tab and click Run
 (Simulation CommandManager).
You need to define an initial frequency study to update
the values of the sensors for each scenario. As a best practice, run the
initial studies and get an estimate of the expected results. When you define
many scenarios, you can also run a few scenarios manually to make sure that
there are no build errors.
-
In the Simulation study tree, right-click the Results
 folder and click Define Mode Shape/Amplitude Plot
 .
.
-
In the PropertyManager, under Plot
Step, for Mode shape
 , type 2 and click
 .
.
The figure shows the second mode shape amplitudes
(AMPRES).
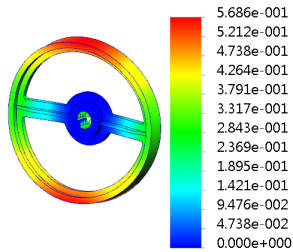
The mode shape
amplitudes have no units and they do not depict actual displacements. Mode
shapes illustrate the profile of the mode only (i.e., the displacement of
nodes relative to each other).
-
In the FeatureManager design tree, under Sensors
, view the results for the
five resonant frequencies.
The following table lists their values. These are also
the results for the first scenario of the Design Study.
| Sensor |
Value |
| Frequency 1 |
715.43 rad/s |
| Frequency 2 |
2150.14 rad/s |
| Frequency 3 |
2160.94 rad/s |
| Frequency 4 |
2576.42 rad/s |
| Frequency 5 |
3467.31 rad/s |