You graph the first principal stresses at a selected location for all scenarios.
-
In the left frame of the design study tab, right-click the Results and Graphs
 folder and select Define Design History Graph.
-
In the PropertyManager, under Y-Axis, select Constraint.
- Select Stress1 for Constraint.
- Under Extra Location, select <Ready> - Design Scenario and select (1) Vertex of Hanger from the selection box.
- Click
 .
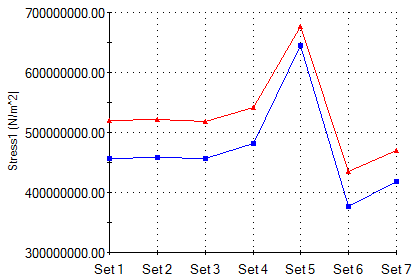
.The graph shows the variations of the 1st principal stress for all scenarios. The maximum values are in red.
- Close the graph window.
Similarly, you can graph the other principal stress components for location 1.